What’s Wrong With Measuring Developer Performance (+ 10 Best Metrics)

Developer performance is a hot topic nowadays, especially during the COVID-19 time when most of us work from our home offices. Executives feel a strong need to measure developer productivity and introduce metrics that look obviously reliable and good from their point of view but in reality have little to no relevance to the complex work of developers, undermining their motivation and morale.
In this article, we’ll take a close look at the notion of developer performance, identify issues related to it and learn from the best gurus about how to measure developer performance and how to recognize quality metrics.
Developer Performance Metrics That Don’t Work
Developer performance refers to how well engineering teams are performing and how successful development operations of the company are.
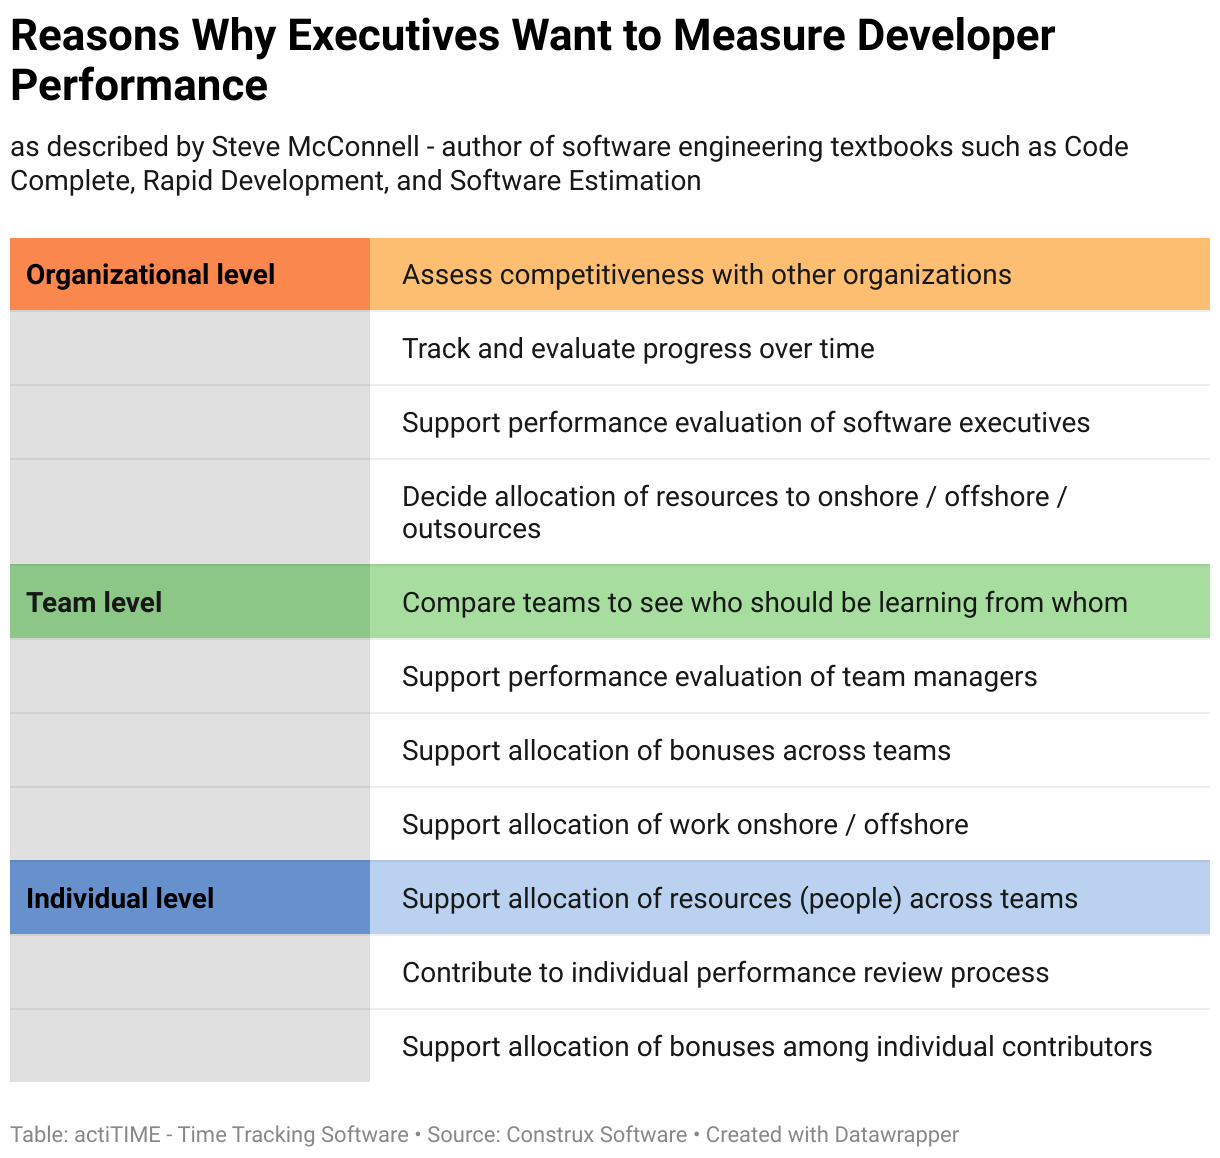
Executives seek to measure performance in development teams for a number of reasons. Steve McConnell, project management and software engineering expert, provides the following most common reasons:
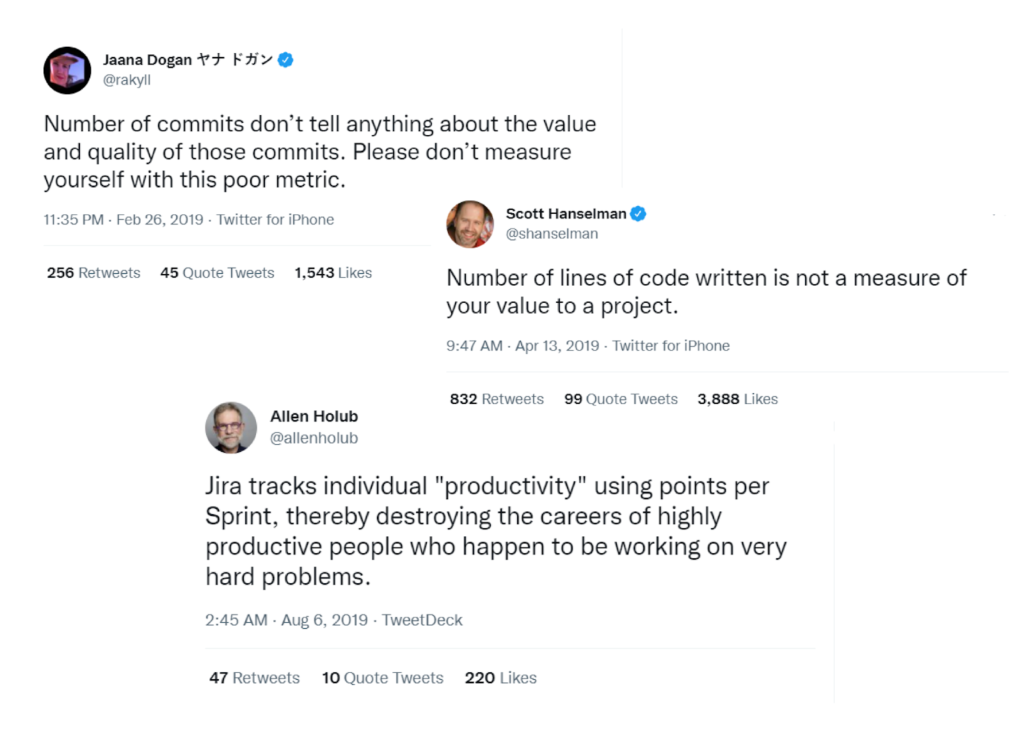
The biggest issue with measuring developer productivity nowadays is that managers introduce metrics that make little to no sense in regards to developer performance. Here are some of the most common examples of the worst developer performance metrics:
- Hours worked
- Lines of code
- Bugs fixed
- Tasks completed
- Number of commits
- Velocity points
- Pull request count
- Features shipped
- Computer activity metrics
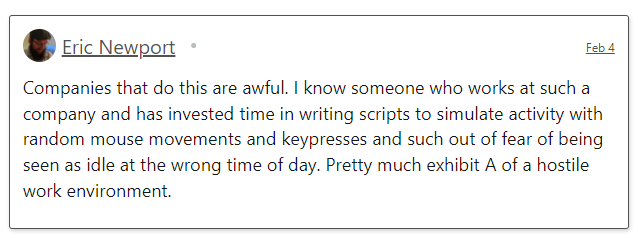
Using these metrics is very likely to be detrimental to developer morale and business growth: neither of them takes into account developer experience, business output or what programming is truly about. Just as lines of code don’t reflect the developer's efforts, number of bugs fixed don’t mean better quality software and low keyboard or mouse activity doesn’t mean anything at all. Instead, these metrics invite developers to game them by writing unnecessary code, creating buggy software or even writing scripts to simulate computer activity.
Now let’s see why developer performance is so hard to measure, why most executives use bad developer performance metrics and are there any reliable metrics at all.
What’s Wrong With Measuring Developer Performance?
Let’s start with the definition of productivity, which equals output divided by input.
Productivity = Output / Input
This formula looks simple, but many issues related to measuring developer productivity can be resolved by referring back to this definition, in particular, to what we mean by input and output in the work of a developer. If any of these components are defined incorrectly, then productivity won’t be measured objectively.
What is developer output?
What should be considered as the output of the developer’s work? Is it lines of code because it’s exactly what developers produce? Is it function points? Or is it bugs fixed? On the contrary, these metrics have little to no relevance to the economics of the business and don’t reflect any degree of developer effort by themselves.
If we remove the business economics from the definition of the output, we’ll get the definition of productivity that is isolated from business profits. Let’s say work on a project was completed successfully but the product turned out to be a total failure on the market so it has no potential to generate any revenue. Judging from this perspective, does it matter if the project was completed on time and the work of developers was effective?
What is developer input?
Input refers to the investments made by developers, such as time and effort. Comparing time across activities makes no sense, because developer activities are more than sets of similar tasks - they involve different degrees of complexity, collaboration and other factors that undermine the reliability of the time metric alone.
Or how do we measure the developer effort? Activity tracking software attempted to measure “productive” user behavior by registering mouse clicks, keyboard taps, types of apps and websites used and time spent on them. While it is a minimal unit of the developer activity, it has nothing to do with productivity or effort.
If you investigate further into possible inputs and outputs, you will neither be able to define what developer input and output are, meaning you are very unlikely to choose reliable developer performance metrics. More than that, accuracy of these measurements is very likely to be subject to the 10x variation phenomenon.
What is the 10x variation phenomenon?
In 1968, Sackman, Erickson and Grant conducted a study where they tried to measure whether people were more productive when programming online or offline. They studied professional programmers with an average of 7 years’ experience and found the following:
- Range of initial coding times: 20:1
- Range of debugging times: 25:1
- Range of program sizes produces: 5:1
- Range of program execution speeds: 10:1
A number of similar studies has been taken since 1968. Take a look at their productivity ratios for teams and individuals.
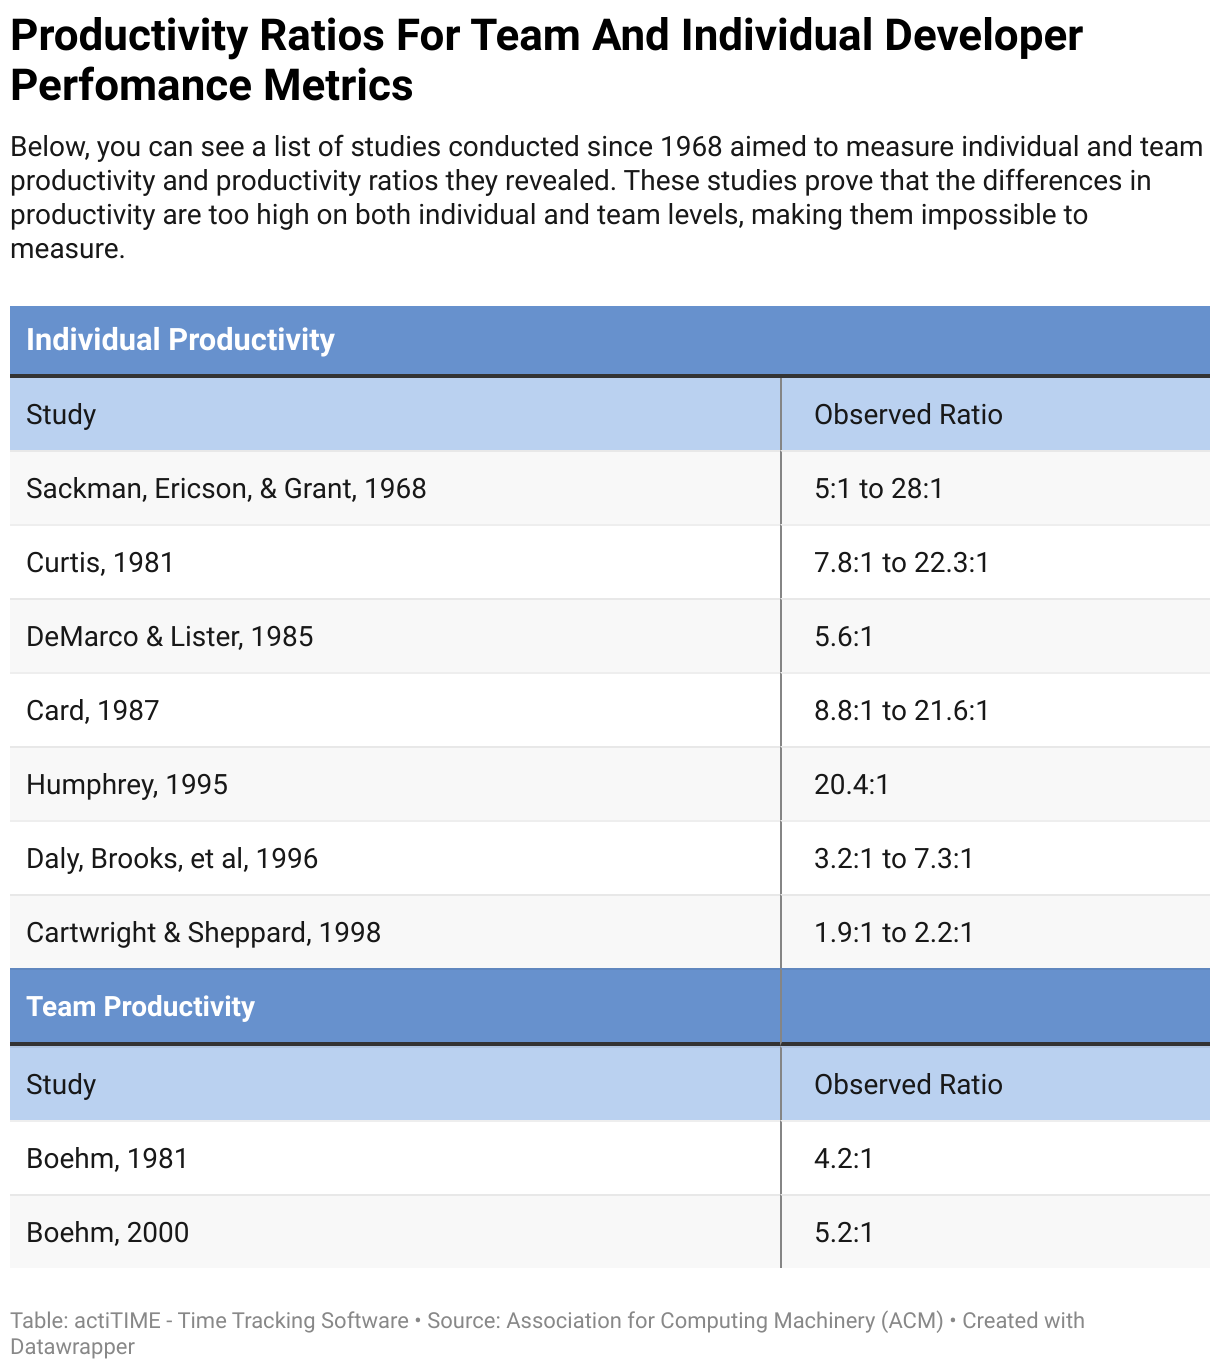
All these studies prove that the differences in productivity are very high on both individual and team levels, which produce the following conclusions:
- The results of these studies proved that if we measure the impact of a process, practice or environmental factor, the measurements will be subject to the 10x individual variation factor, meaning that they are very unlikely to be valid.
- And if we try to assess individual or team productivity, these measurements will be confounded by process, practice or environmental differences between projects.
How to Maximize Accuracy of Developer Performance Metrics
The good news is that we can maximize the accuracy of the metrics. Steve McConnell developed a list of attributes for identifying reliable performance metrics. More than that, he evaluated the most commonly used team-level developer performance measurements according to them:
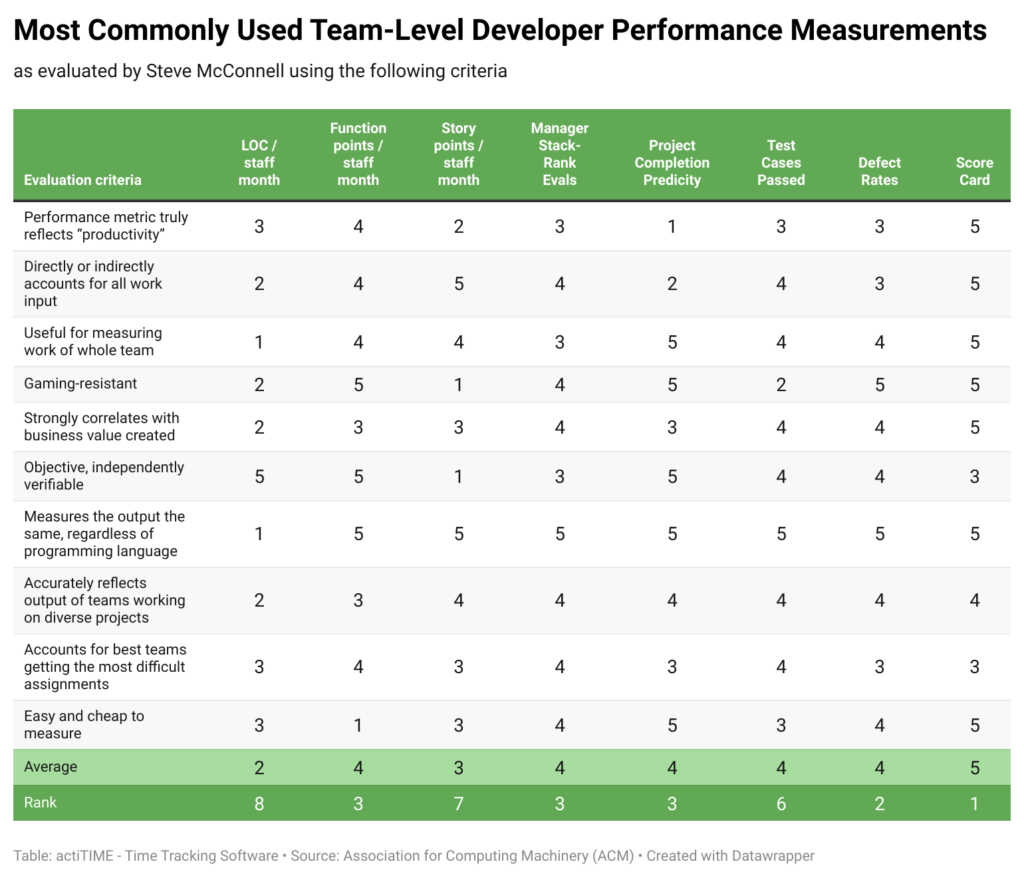
So, the leading measurement is scorecard: it contains a set of developer performance metrics, which makes it highly reliable and accurate in terms of reflecting productivity. If you include metrics that account for work input of the whole team and reflect the acquired business value, your scorecard will display the most accurate developer performance evaluation with the 10x individual variation factor kept to the minimum.
Even if you don’t want to introduce scorecards, the biggest lesson is to rely on a set of metrics accounting for developer input and output and avoid individual metrics such as lines of code (the most unreliable according to Steve McConnell’s evaluations), tasks completed, commits made or features shipped.
So, let's see what are the best developer performance metrics you might want to start tracking in your team of developers.
10 Best Developer Performance Metrics?
Below, we’ve combined 10 best developer performance metrics for teams recognized by Google (the 4 DORA metrics), Abi Noda - Senior Product Manager at GitHub and Roy Osherove - author of Art of Unit Testing and Notes to a Software Team Leader with over 20 years in technical & testing roles.
1. Deployment frequency (DORA)
What it measures: How often an organization successfully releases to production.
Measurement: Deployments per day
Impact potential: Increase customer value by reduced Time-to-Market
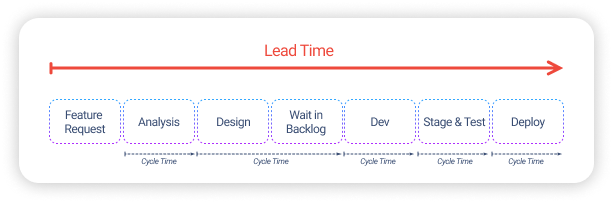
2. Lead time
What it measures: How much time is between the beginning of a project’s development and its delivery to the customer
Measurement: Lead time in days
Impact potential: Increase project planning accuracy
3. Cycle time (Roy Osherove)
What it measures: How much time do individual project stages take
Measurement: Cycle time in days
Impact potential: Increase project planning accuracy
4. Lead time for changes (DORA)
What it measures: How much time it takes a commit to get into production
Measurement: Lead time in days
Impact potential: Increase developer efficiency
5. Velocity (Agile metric)
What it measures: The amount of work that your team can accomplish in a given amount of time (sprint)
Measurement: Man-hours or story points
Impact potential: Improve project and sprint planning
6. Work-in-progress (Agile metric)
What it measures: The the state of the work in progress
Measurement: Number of tasks in progress
Impact potential: Identify bottlenecks and sunk costs
7. Change failure rate (DORA)
What it measures: The percentage of deployments leading to a degradation in service that must be addressed
Measurement: Number of incidents divided by number of deployments
Impact potential: Increase customer satisfaction by decreased number of outages
8. Time to restore service (DORA)
What it measures: How long it takes an organization to recover from a failure in production
Measurement: Restore Time in hours
Impact potential: Increase customer satisfaction by decreased number of outages
9. Customer satisfaction score
What it measures: How satisfied a customer with your products or services
Measurement: Surveys with scales and open questions
Impact potential: Improve customer relations and satisfaction
10. Team health (Agile)
What it measures: Distribution of work among team members
Measurement: Work items distribution in terms of type and quantity
Impact potential: Create fair team workload distribution
Ready to Improve Developer Performance?
Measuring developer performance is not easy: you need to track project management metrics, calculate business costs and profits, and rely on time metrics to plan your projects with the maximum accuracy. Nowadays, you can do most of these things in time and project management systems.
For example, actiTIME provides a time and project management system where you can manage workloads, review project progress, see business costs and profits and more.
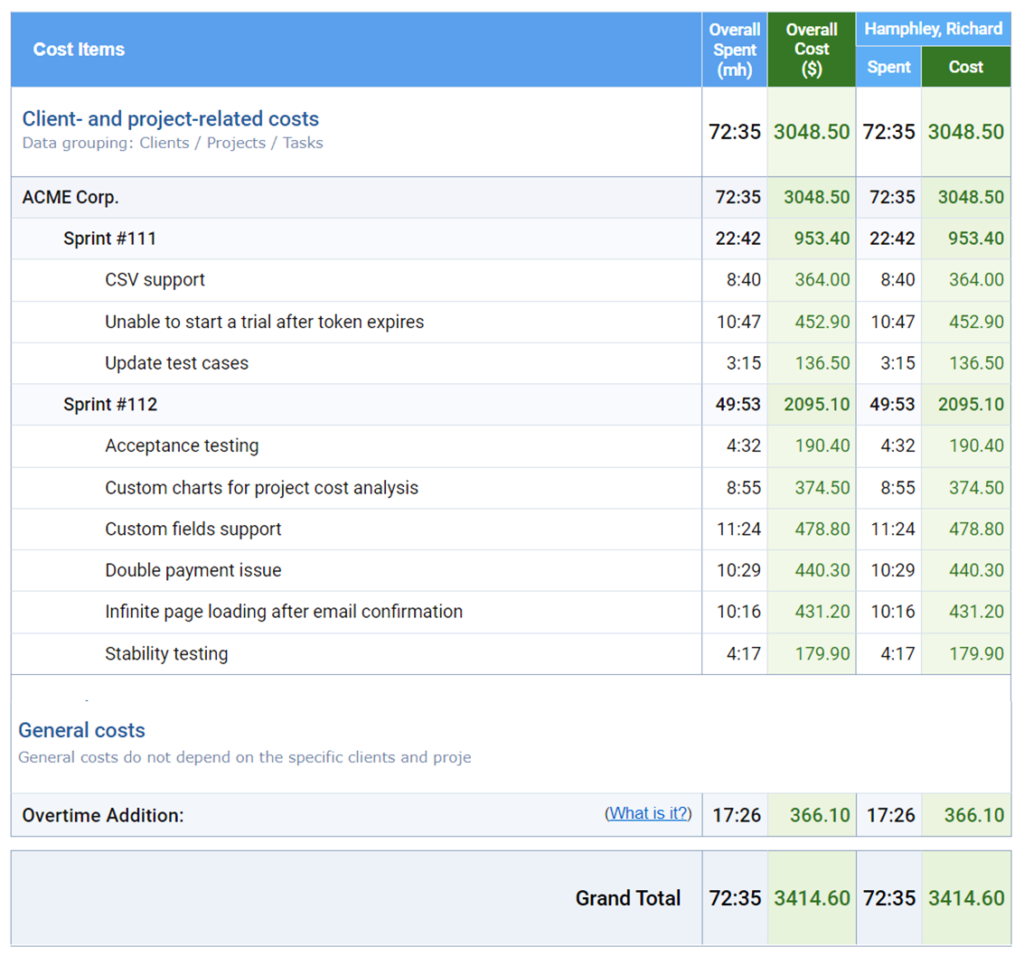
Build custom workflows, assign tasks to your team members and see how time and money costs are distributed across tasks, project stages, projects and clients.
Set up deadlines, time estimates, time or cost budgets. Create custom fields for tasks to upgrade your time, cost and performance reports and see how similar items perform.
Choose from 2,000+ integrations, including JIRA, GitHub and JitLab. Join 10,000+ companies like DHL, Huawei, Philips and Xerox - try a free 30-day trial (no credit card required).